Data Collection
Study area and site selectionTo survey mammals, we deployed 89 camera traps between May 2018 and September 2021 across a gradient of urban density throughout the city of Edmonton (Figure 4-5). Sites occurred in natural (n=69) and modified (n=20) areas. The camera trap locations were selected across four transects emanating from Edmonton’s urban centre in the NE, NW, SE, and SW directions. The NE and NW transects ran parallel to the river valley corridor, and were assumed to include highly connective forested habitat. The NW and SE transects ran perpendicular to Edmonton’s river valley corridor, and was assumed to contain lower landscape connectivity due to isolated green spaces and disconnected ravines. Sites were selected within ~2km of each transect and were separated by at least 1 km or did not overlap temporally. Camera traps were triggered by either motion or infrared heat and were placed on a tree or post at 1 m height. All cameras were positioned to face an open area, game trail, or between two trees (Magle et al. 2019).
|
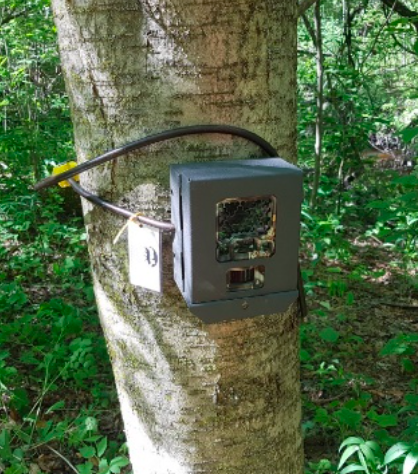
Figure 3. An example of a camera trap deployment in a the City of Edmonton. Camera were fixed 1 meter high on tree or post and were secured with a metal bracket or python lock.
|
|
Figure 4. Map of the study region, the City of Edmonton, Alberta.
|
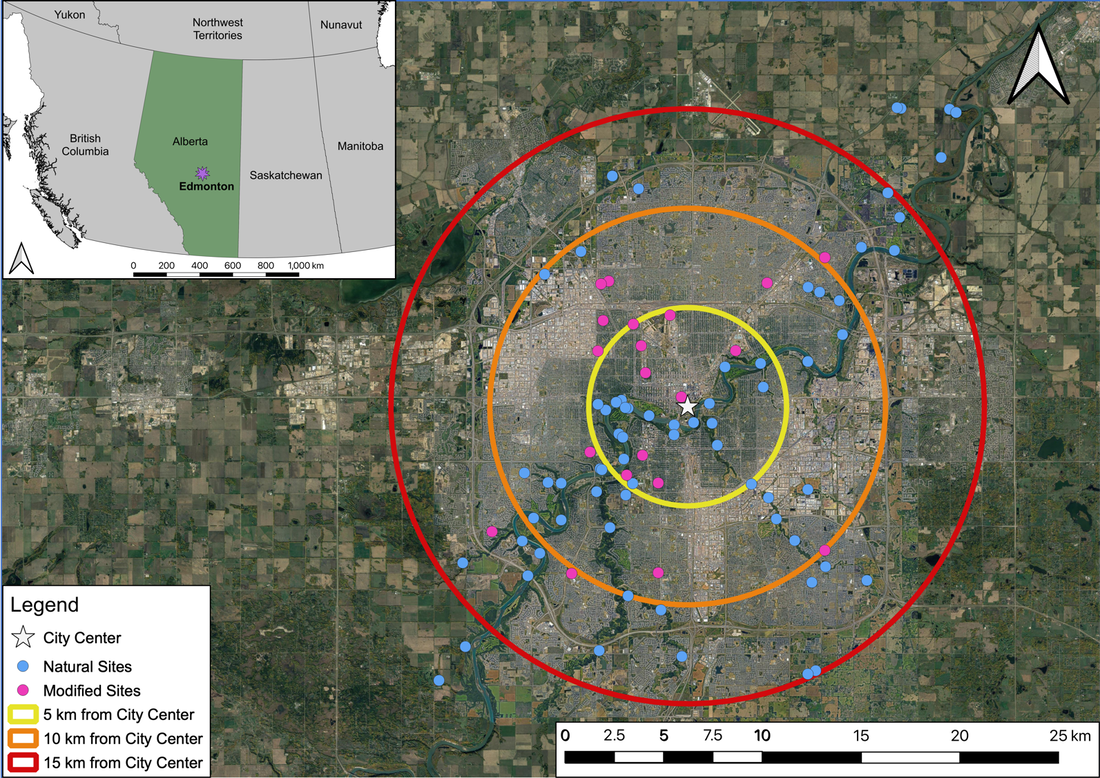
Figure 5. Locations of the 89 camera traps placed in natural (n=69; blue) and modified (n=20; pink) areas in Edmonton, Alberta. Distance from city center (5km, 10km, 15km) is marked by coloured circles. The city center is marked with a white star.
|
Image ProcessingAfter cameras were retrieved, Timelapse2 was used to derive monthly detection rates for 22 terrestrial mammal species. Detection rates were expressed as the count of independent detections per month using 30 minutes as the threshold of elapsed time between consecutive images of the same species to define separate events (Burton et al. 2015; Avrin et al. 2021).
|
Figure 6. A slide show of camera trap images taken between 2018 and 2021 in the City of Edmonton.
|
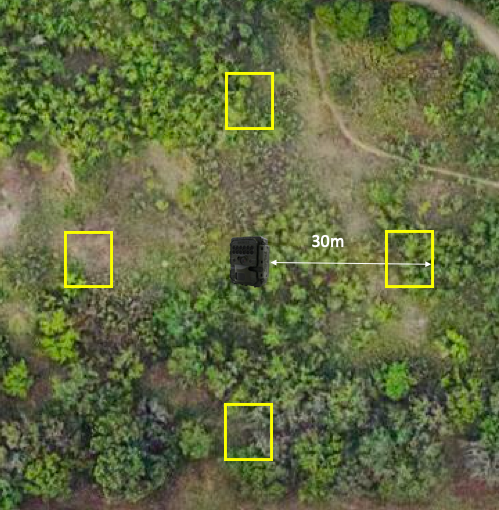
Figure 7. Diagram of cover plot surveys conducted at each camera trap site in Edmonton. Yellow squares represent the four cover plots placed 30m North, South, East, and West of each camera trap.
|
Vegetation surveysField surveys were conducted at each camera site in the summer of 2019 to obtain various cover measures. Cover variables were continuous and expressed as percentages. Cover variables included canopy cover, shrub cover, grass/forb cover, leaf litter cover, and woody debris cover. We measured each variable as the average of four cover plots placed at 30 m from each camera in all cardinal directions. Additionally, vegetation diversity was measured at each site by counting the number of plant species within the four cover plots. Surveys were guided by the City of Edmonton Temporary Sample Plot (TSP) and Permanent Sample Plot (PSP) Procedures (City of Edmonton 2016) and Urban Ecological Field Guide (City of Edmonton 2015).
|
Determining landscape variables
ArcGIS was used to derive four geographic information system layers: buildings, roads, urban Primary land and Vegetation Inventory, and unique landforms (river valley/ravine). To extract explanatory metrics related to land cover, land cover from the City’s uPLVI, unique landforms, and land use layers were collapsed as five land cover types: natural forest, natural grass/shrub, modified vegetation (grass/shrub/trees; excluding maintained grass), maintained grass, the river valley and ravine system, and housing. Additionally, the uPLVI, sidewalk, road, and building layers were used to calculate the cover of impervious surfaces. A 500m buffer was chosen for density and proximity metrics as is it encompasses the home range of many of the focal species while avoiding pseudo replication (Hämäläinen, Fey, and Selonen 2018; Miguet et al. 2015).
