Data tables
Table 1. Data table showing the land class and vegetation cover variables for all 89 camera trap sites in the City of Edmonton. Remotely sensed variables include whether a site was in the river valley and ravine system (i_rv), density of natural forest (d_nf_500), density of natural shrub (d_ns_500), density of natural vegetation (d_nv_500), density of modified vegetation (d_mv_500), density of maintained grass (d_mg_500), density of buildings (d_bu_500), density of roads (d_ro_500), density of houses (d_hous_500), and density of impervious surfaces (d_imperv_500). All proximity and density values were calculated within a 500 m buffer of each camera site using GIS. Vegetation cover variables include canopy cover (s_canopy), woody debris cover (scov_wd), leaf litter cover (scov_leaflit), grass and forb cover (scov_grassforb), shrub cover (scov_shrub), and vegetation diversity (scov_divers). Vegetation cover variables were measured as the average of 4 cover plots placed 30m from each camera site. The table also includes site code (analysis_site), site name (locationna), whether the site was natural or modified (nat_mod), and distance from city center (dist_cc; <5km, 5-10km, 10-15km, >15km).
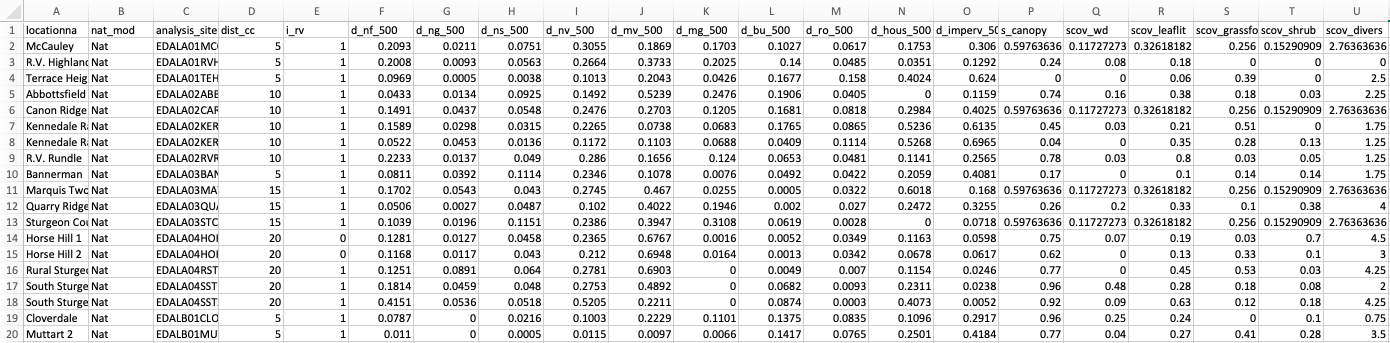
Table 2. Data table showing species detection per month at each camera site in the City of Edmonton. The number of independent detections of each species was summed by month. There were 22 mammal species detected by the remote cameras. The diverse column indicates the average number of species detected per month at each site. The table also includes site code (analysis_site), year, month (mth), month number (mth_num), the number of days in the month (daysmth_full), the number of days the camera was active in the month (active), and season (season_sol). The first image in the slide show shows the first 20 columns and second image shows the remaining 21 columns.
Predictor variables
The predictor variables comprise of 11 remotely-sensed variables and 6 vegetation cover variables derived from field surveys.
Remotely-sensed predictor variables (Table 1):
Remotely-sensed predictor variables (Table 1):
- Binary: whether the site was in the river valley (i_rv; 0=no, 1=yes)
- Continuous (%): density of natural forest (d_nf_500), density of natural shrub (d_ns_500), density of natural vegetation (d_nv_500), density of modified vegetation (d_mv_500), density of maintained grass (d_mg_500), density of buildings (d_bu_500), density of roads (d_ro_500), density of houses (d_hous_500), and density of impervious surfaces (d_imperv_500)
- Categorical: distance from city centre (less than 5km, 5-10km, 10-15km, or greater than 15km)
- Continuous (%): canopy cover (s_canopy), woody debris cover (scov_wd), leaf litter cover (scov_leaflit), grass and forb cover (scov_grassforb), shrub cover (scov_shrub)
- Continuous: vegetation diversity (scov_divers)
Response variables
The response variables are species frequencies for 22 species detected at remote cameras (Table 2). To account for the varying length of camera operational time among sites, species frequencies were standardized as mean detections/month for each camera trap site. Species detection/month are continuous variables.
Exploratory graphics
Vegetation cover
Histograms were used to determine the distribution of vegetation cover data (Figure 8). The distribution of the data was deemed acceptable for normality and these variables were not transformed. It was noted that woody debris cover (Figure 8b), grass/forb cover (Figure 8d), and shrub cover (Figure 8e) are zero-inflated. Due to the zero-inflation of these variables, a distance based analysis was chosen over a rotation based analysis for subsequent data analysis.


|


|


|
Figure 8. Histograms showing the percentage of (a) canopy cover, (b) woody debris cover, (c) leaf litter, (d) grass and forb cover, and (e) shrub cover, as well as (f) vegetation diversity for 89 camera trap sites in the City of Edmonton.
Remotely-sensed land cover
Histograms were used to determine the distribution of remotely-sensed density of land cover variables (Figure 9). Data were not transformed, but it was noted that all 9 landcover variables are zero-inflated. Due to this zero-inflation, a distance based analysis was chosen over a rotation based analysis.


|


|


|
Figure 9. Histograms showing the density of (a) natural forest, (b) natural shrub, (c) natural vegetation, (d) modified vegetation, (e) maintained grass, (f) buildings, (g) roads, (h) houses, and (I) impervious surfaces within a 500m buffer of camera sites for 89 camera sites in the City of Edmonton.
Number of species detections
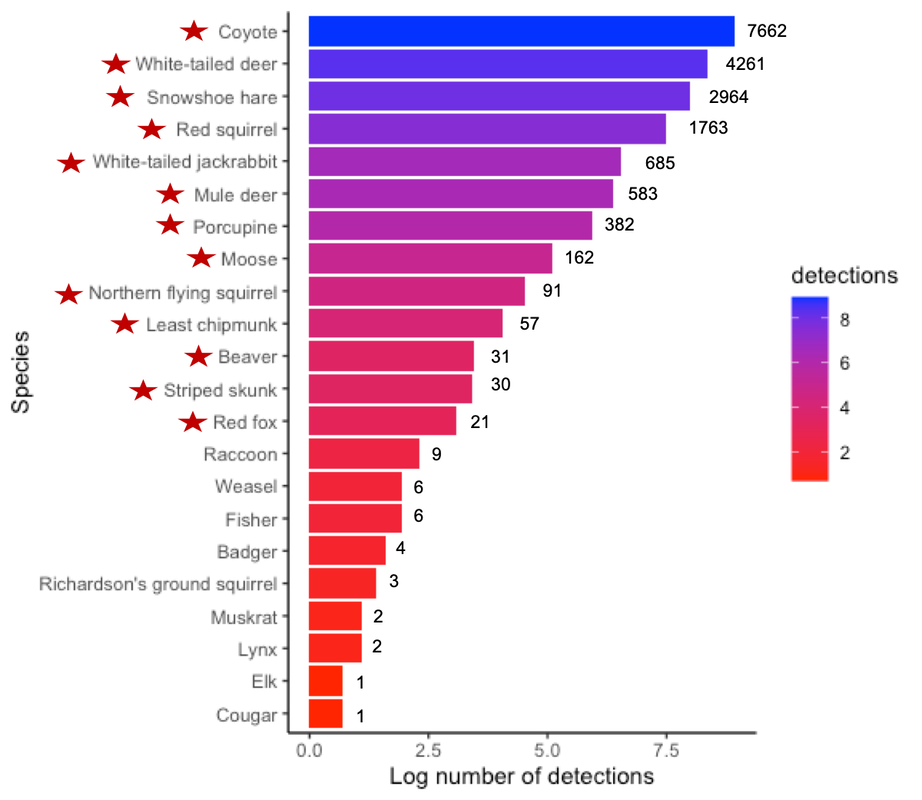
Figure 10. Log-transformed number of detections for 22 mammal species from 89 camera traps in Edmonton from 2018 to 2021. The number of species detections were log transformed for better visualization. The actual number of detections for each species are indicated by the values to the right of the respective bar. Red stars indicate the 13 species that had a sufficient number of detection to be used in further analysis.
